Aim:
To estimate the concentration of protein using Bradford Method.
Principle:
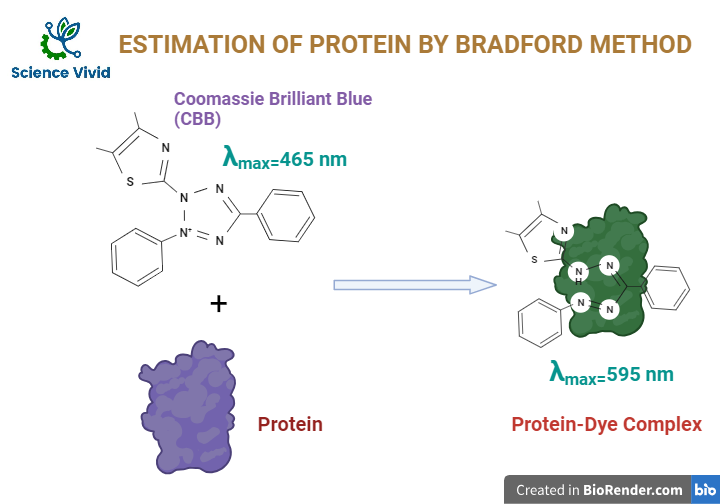
The Bradford protein assay is a commonly used method for estimating the concentration of proteins in a sample. Generally, it is based on the binding of Coomassie Brilliant Blue (CBB) dye to proteins, resulting in a shift its maximum absorbance maximum from 465 nm to 595 nm. The orginal maxium absorbance of CBB is 465 nm and if it binds with the protein the absorbanc will be shifted to the 595nm resulting in a change in color from brown to blue. The Solution of CBB is originally brown and after linked with the protein molecule the color will be changed to blue color complex. The strong noncomplex bond is formed between carboxyl groups of the protein and dye by van der Waals force and amino group through electrostatic interactions.
The amount of protein in a sample is determined spectrophotometrically by measuring the absorbance of the blue-colored solution at 595 nm and comparing it to a standard curve generated using known concentrations of protein.

Fig: Estimation of protein by Bradford method
Reagents Required:
- Bradford reagent: Dissolve 100 mg Coomassie Brilliant Blue G-250 in 50 ml 95% ethanol/Methanol, add 100 ml 85% (w/v) phosphoric acid. Make up to 1 liter after the dye has completely solubilized, and filter through filter paper before use.
- Protein Standard: 1 mg BSA/ml.
Apparatus and Glass wares :
Test tubes, Pipettes, Colorimeter, filter paper, funnel, etc.,
Procedure:
- Prepare the aliquots of Pipette out 0.0, 0.2, 0.4, 0.6, 0.8 and 1 ml of working standard BSA into the series of labeled test tubes. And, make up the volume to 1 ml in all the test tubes using distilled water.
- 1 ml of the given test sample in another test tube and labelled as “Test” and 1 ml of distilled water in another fresh tube and labeled as “blank”.
- 1 ml of freshly prepared Bradford reagent is added to all the test tubes including the test tubes labeled ‘blank’ and ‘test’.
- Mix the contents of the tubes uniformly by vertexing / shaking the tubes and incubate at room temperature for 10- 15 mins.
- Finally, the absorbance of the all-test tube is recorded at 540 nm against blank in the spectrophotometer.
Observation Table:

Fig: Estimation of protein by Bradford method ( Observation Table)
Results and Interpreation:
Calculate the protein concentration of the given test samples from the standard curve using the know concentration of BSA solutions. A standard curve is created by plotting the absorbance values of the standard solutions against their corresponding protein concentrations. Finally, the resultant standard curve is used to determine the protein concentration of the test sample based on its respective absorbance. he concentration of the given test solution can also be calculated using the given formula:

